Welcome to WordPress. This is your first post. Edit or delete it, then start writing!
Blog
-
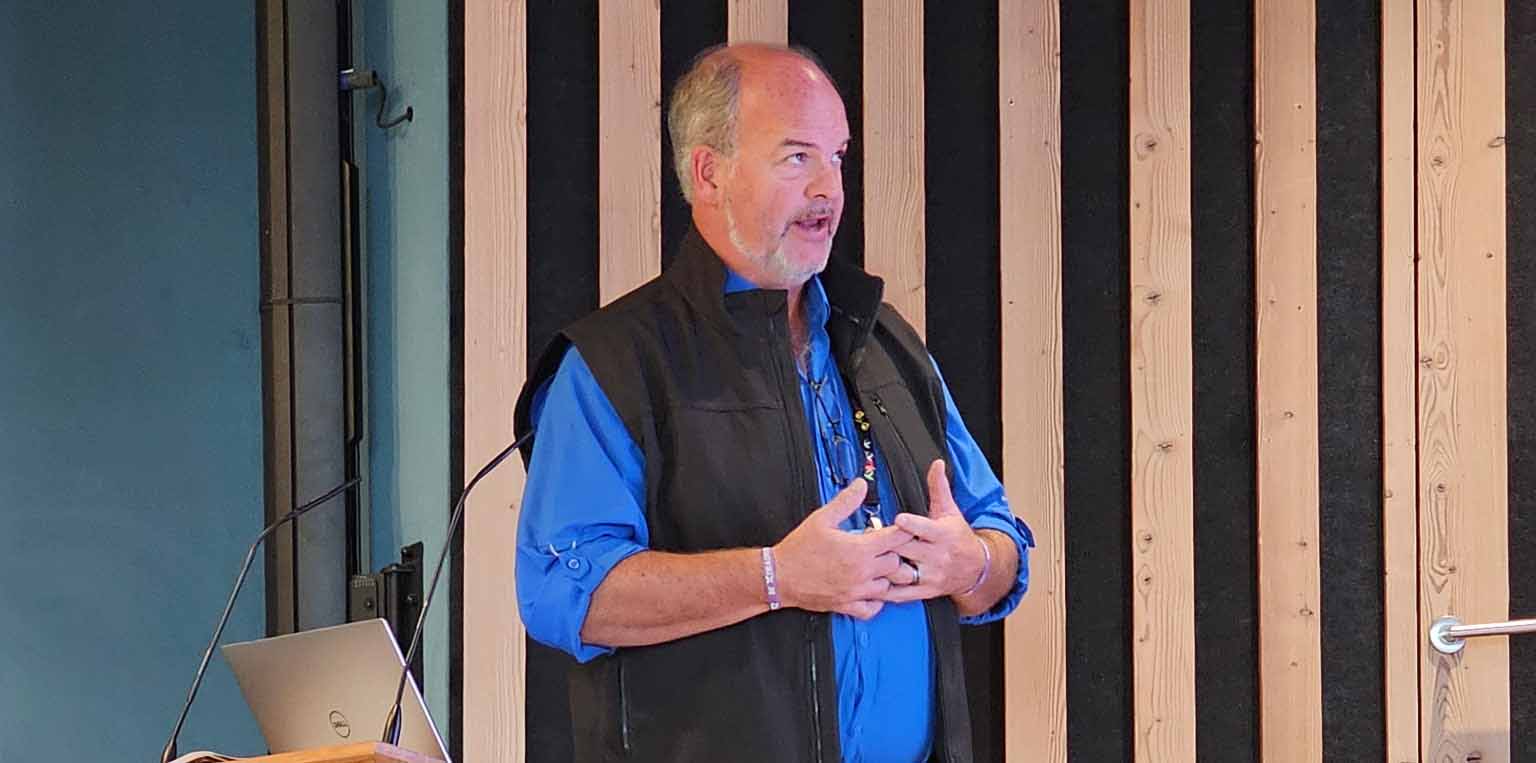
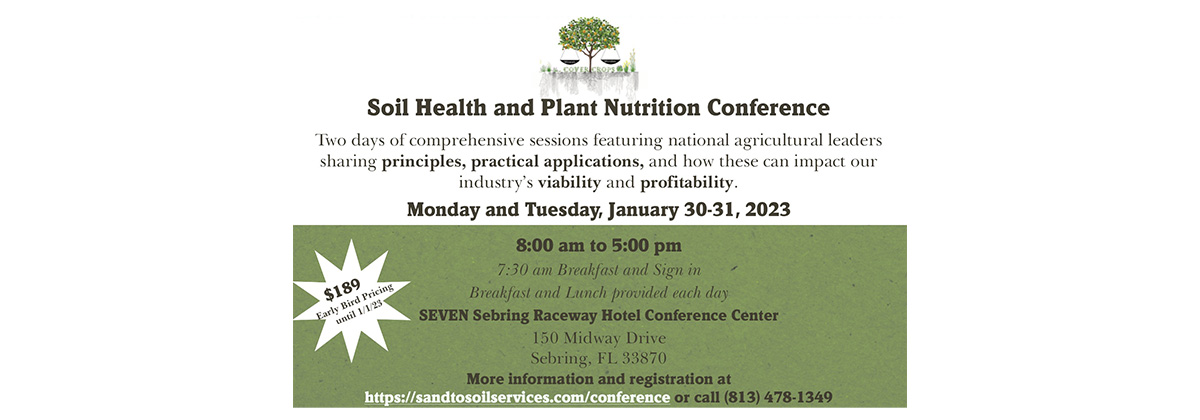
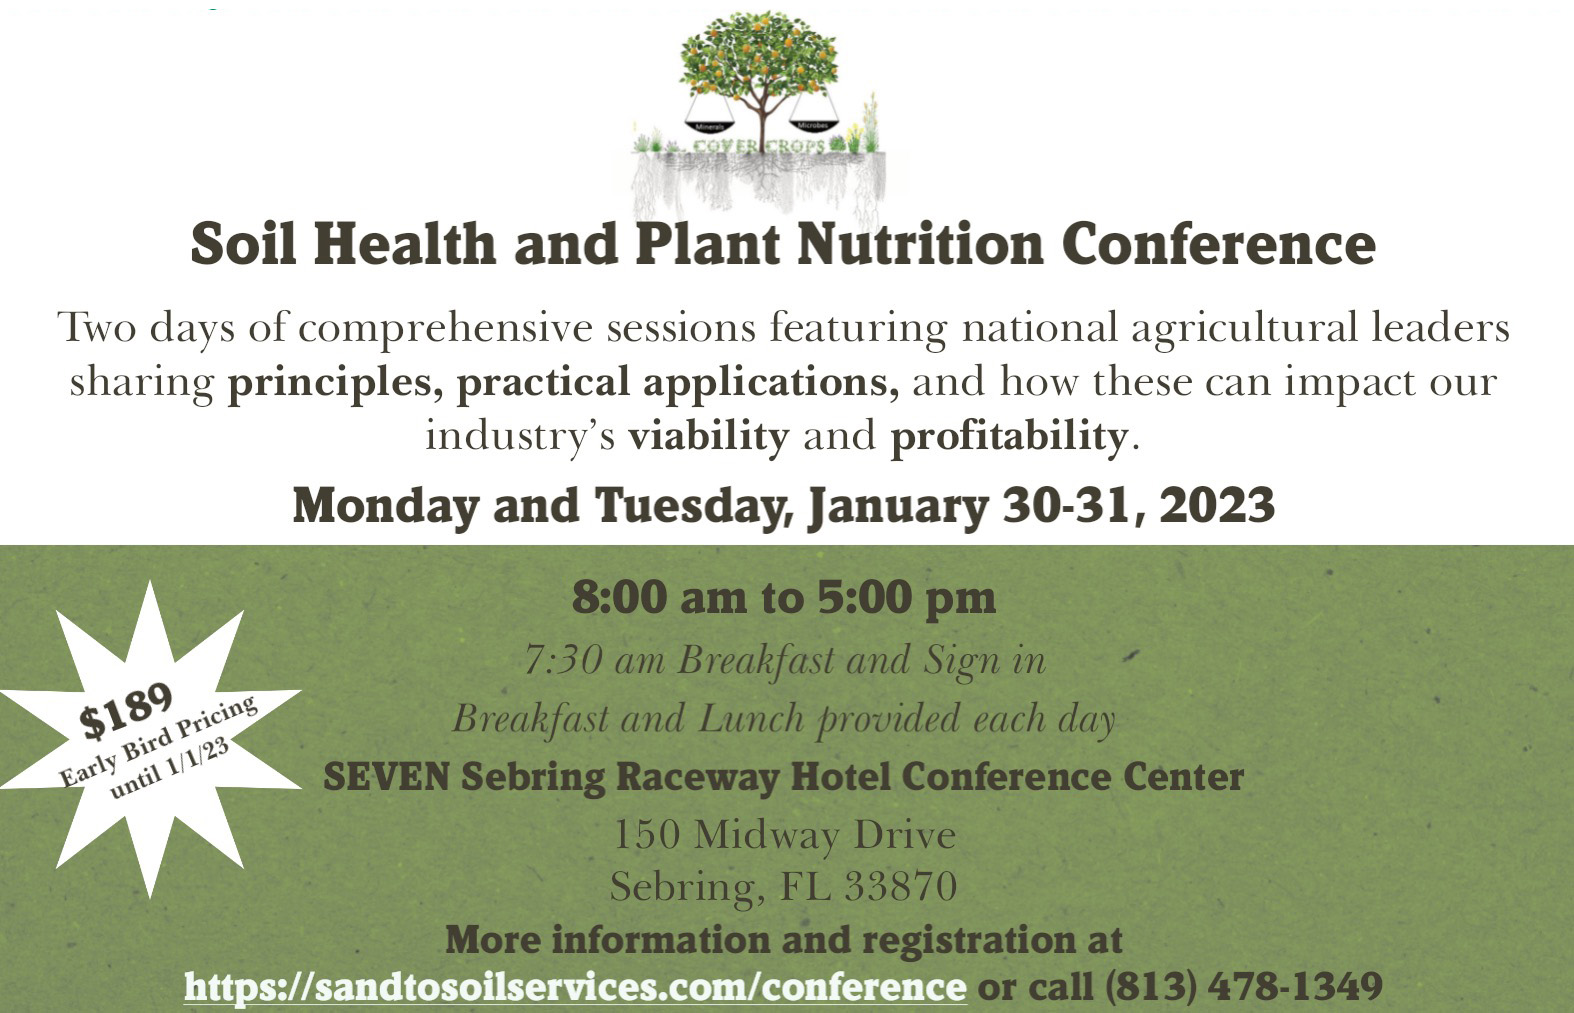
The Soil Connection Conference
PAST EVENT
February 23, 2023
Traverse City, MichiganStay tuned for CSI Soil Health seminar in January of 2027. Contact Us for more information.
-
Grower—Grazier Newsletter Autumn 2022
In This Edition: Procrastination vs Reality | Visibility at Conferences? | Florida Citrus | High Fertilizer Prices | Product Trials and Grower Observations– CalAcid and NStar | Subtle Energies, Dowsing, Radionics- SE-5 | Forage Plots…Attracting deer and building soil health! | Soil Testing: New Packages, Pricing, and Submission Form
[button link=”https://app.box.com/shared/static/c9e26ltxzedj57ehjivsvojnggm3afjh.pdf”]Download the PDF newsletter[/button]
-
2020 Acres Eco-Ag Conference and Trade Show
We’ll be live December 1 – 4, each day from 3:15-5:15 pm. No registration required!
[button window=”yes” link=”https://eventhub.shop/2020-eco-ag-trade-show/crop-services-international”]Tune In at Event Hub[/button]
We are also having special Q&A session at these times on these topics…anyone can log in even if they aren’t a registered ACRES attendee.
Tuesday, Dec. 1st
11:00am-12:30pm: Soil Testing/Interpretation
1:00-2:30pm: Small Scale Home Gardens
3:15-5:15pm: Exhibit Booth LiveWednesday, Dec. 2nd
11:00am– 12:30pm: Lawns & Landscapes
1:00-2:30pm: Compost Teas/Extracts
3:15-5:15pm: Exhibit Booth LiveThursday, Dec. 3rd
11:00am-12:30pm: Row Crops
1:00pm-2:30pm: Pasture & Pasture Crops
3:15-5:15pm: Exhibit Booth LiveFriday, Dec. 4th
11:00am-12:30pm: Cannabis/Hemp
1:00-2:30pm: Blueberries/Raspberries
3:15-5:15pm: Exhibit Booth Liveall times Eastern Standard
[button window=”yes” link=”https://eventhub.shop/2020-eco-ag-trade-show/crop-services-international”]Tune In at Event Hub[/button]
-

Grower—Grazier Newsletter Autumn 2020
In This Edition: Our Connectedness | Urban Farms | Living Soil– Indoor Cannabis | Sowing Diamonds Carbon in our Soils | Profitability in Row Crops | Organic Row Crops | Gardening– Soil Test | Healy by Dr Phil
[button link=”https://app.box.com/shared/static/0xxd1qxu3s7ml41dvvsu4fly4tiebw1u.pdf”]Download the PDF newsletter[/button]
-
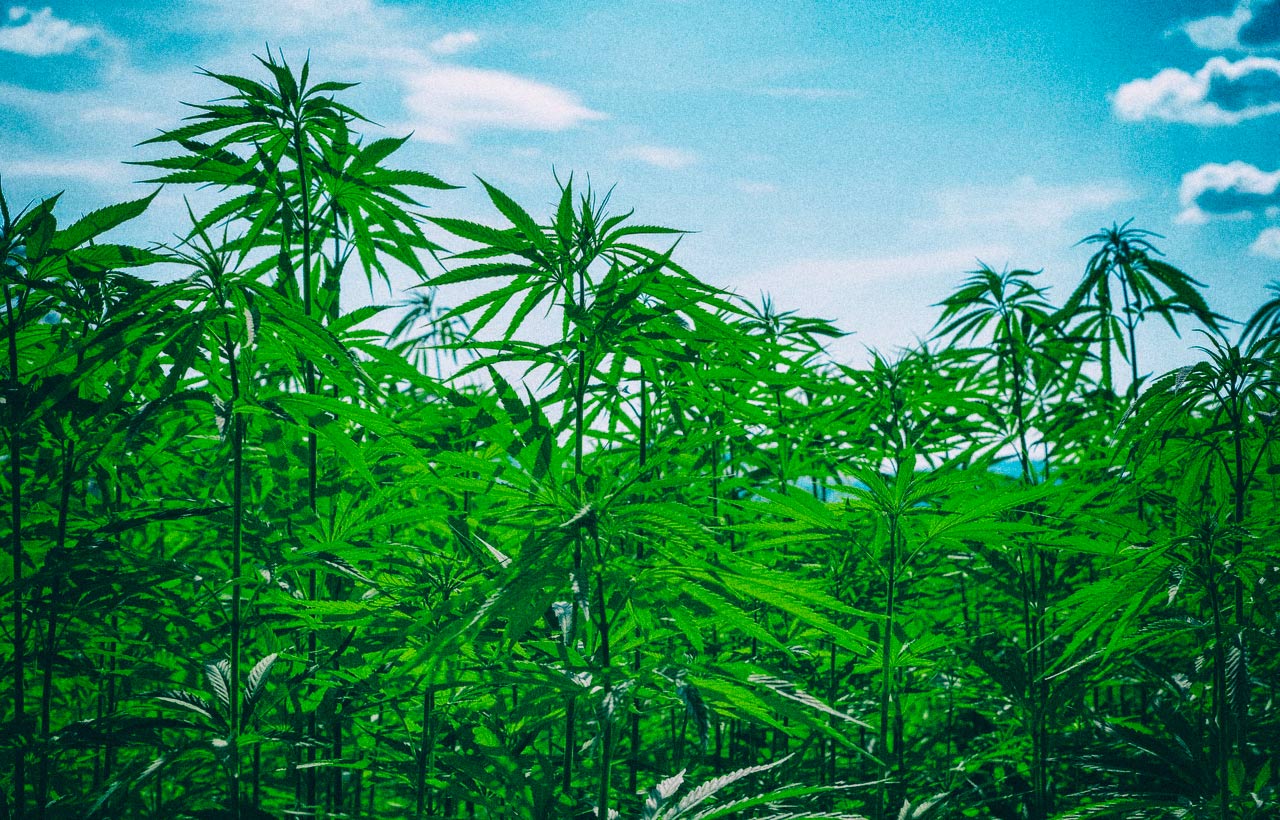
Cannabis and Hemp Production…Soil Testing is the Basis!
The recent Farm Bill supported the inclusion of Hemp production as a legal and viable agricultural crop. This along with the increasing desire to grow and cultivate both medicinal and recreational cannabis in various states has created quite a fury of soil samples coming into CSI from growers all over the US.
Chuck Holman, one of CSI‘s consultants, who works out of Missoula, MT. is right in the middle of 45,000 acres of hemp production according to the MT Dept of Ag. With the increasing interest in hemp, Chuck aligned himself with a group that organized and formed the Montana Hemp Cooperative (MHC). Montana has been growing hemp for a few years through pilot programs as health supplements, soap ingredients and jet fuel alternatives. Those past endeavors didn’t have much success, so the direction of the MHC is to focus on farmers producing Hemp for Seed and Fiber. The foundation of this Farmer-Owned Cooperative is to provide education, processing, marketing and regulatory support for their members.
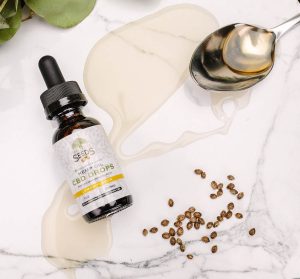 Education is paramount as growers need to understand there are vast differences between growing Hemp for seed, fiber and CBD oil production. Unfortunately a lot of “Bad Actors” selling seeds, clones, and products to growers who don’t truly understand the nuances of the plant thus setting them up to fail. The Cooperative is also assisting growers with harvest, processing and marketing hemp. Another important concept of the Cooperative is the collective ability for purchasing power, sharing knowledge and to fight for regulations of this revived industry in support of the farmer.
The goal of the Coop is to have their own fiber processing facility in the state. They are currently signing farmers up to grow hemp on all or a portion of their acreage. For more information concerning the Montana Hemp Cooperative contact Chuck at 406-529-4119.
From our perspective, a green plant is a green plant and as such the soil, or the planting media, is the critical component regardless if you are growing hemp for CBD, Seed, Fiber or Cannabis for medicinal purposes. Like every other crop it requires basic mineral balance, good soil structure to support air/water exchange and a fully functioning soil foodweb. Combine this with optimal nutritional levels in the plant and then any plant can express their true potential (yield, nutrient density, flavor, aroma, and medicinal qualities.)
If you are considering growing hemp or cannabis:
- Send soil to CSI for Testing and Recommendations.
- Seek supplier for seeds/clones.
- Learn about harvest/storing.
- Secure a market for your crop.
- Last! Put plants/seeds in Soil.
CSI doesn’t have all the answers, but has aligned ourselves with companies and individuals that have experience with this cropping system. Give us a call! 800-260-7933
-
Measuring Food/Crop Quality…And Getting Paid for Quality
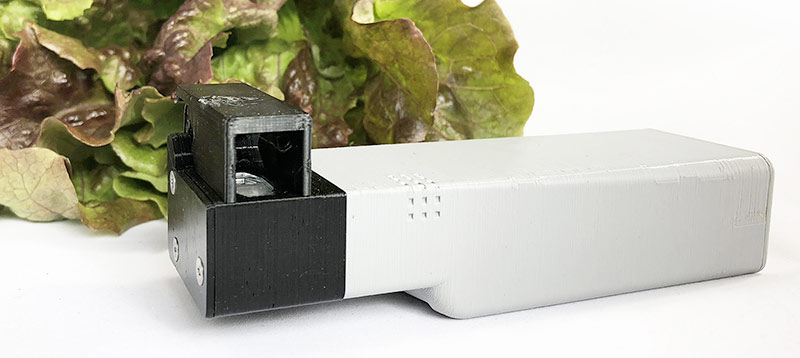
Have you ever had a fantasy about having a tool that will measure the true quality of fruits and vegetables that you are producing at your farm or purchasing in the produce aisle or at the farm market? The best tool, until now, has been the refractometer to measure Brix. While Brix testing is a great management tool for growers, produce managers and farm market vendors strongly oppose consumers cutting a fruit or vegetable and squeezing the juice onto a refractometer or taste testing prior to purchasing. The development of such a tool that is based on a set of criteria (mineral density, antioxidant levels, proteins, and other parameters) is underway and data collection is ongoing. This handheld device will report a “value” of the fruit/vegetable through an app on your cell phone in real time. This is closer than you might think thanks to the vision of Dan Kittredge, founder of the BioNutrient Food Association (BFA).
Most of agriculture is built on the business model that production yields are the basis for growing food. It is how farmers are paid; the more yield, the more income…assuming there is a buyer. The quality of the food produced is ignored in this paradigm. Dr Carey Reams is the pioneer who popularized the concept of Brix testing, because he understood that higher Brix food had higher mineral content, where as lower Brix food lacked the nutritive value. He also taught that “All Disease was a result of a mineral deficiency!” This is applicable for plants, animals and humans. Given the current state of agriculture: insecticides, fungicides and simplistic N-P-K fertilizer, it is crystal clear the amount of balanced nutrition in our food is lacking. The extent of chronic illness in livestock and humans confirms Dr Ream’s concept. If your customer or consumer of your crop could measure the quality…would they buy it? Would they be willing to pay more for your pint of blueberries, tomatoes or carrots because they tasted better, had better nutrient levels, had more anti-oxidants than your competition at the farm market, the produce aisle or your roadside stand? The technology is here: the data collection is happening. The tool aptly named the BioNutrient SpectroMeter is real.
Dan Kittredge spent his life growing organic food for his family and his customers. Struggling with pests and disease on his crops and understanding the correlation of soil and plant health to environmental and human health, Dan’s journey began with the mission of “Increasing quality in the food supply.” The inherent challenge in his journey is “what determines quality and how do we measure it?”
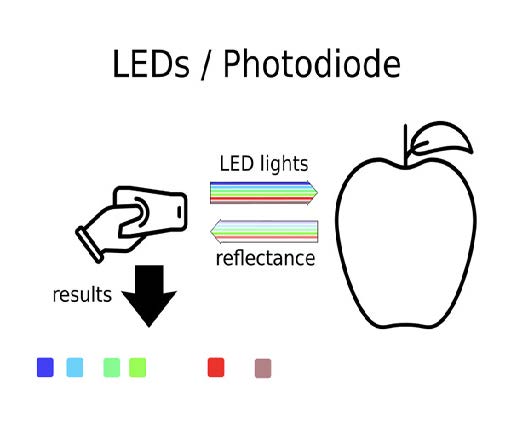 Fast forward to November 2017 at the BioNutrient Food Association’s 7th Annual Soil and Nutrition Conference titled “Growing the Food Movement Around Food Quality.” At this conference, the BFA launched the Real Food Campaign to bridge the food, health, environmental, and climate movements and provide tools for transparency in the food supply. The allure of this conference included the presentation of the BioNutrient SpectroMeter to measure food quality, not to mention a speaker lineup “next to none.” As a speaker at the 2016 conference, the writer of this article embraced the opportunity to be an attendee and vendor at this dynamic conference. The preconference track included the presentation of the beta version of this meter that measures food quality (nutrient density.) The BioNutrient SpectroMeter uses light reflectance to measure nutrient density of a crop with results in real time. This light reflectance concept is not new, and with technology it is small enough to be integrated on a cell phone. At that time the focus was collecting data on specific crops and building a database of nutrient levels to define relative quality and determine if there is variability. Sample analysis, data collection and interpretation was/is being completed at the Real Food Campaign Lab located Ann Arbor, MI. The current data collection includes measurements for nutrients, vitamins, polyphenols and antioxidants. Future analysis may include additional metrics like flavonoids (flavor) and essential oils (aroma.)
To begin proof of concept, the process started in 2018 with carrots and spinach from seven states, and 50 unique stores and 68 farms/gardeners. 648 carrot and 181 spinach samples were analyzed and here are a couple highlights:
- Polyphenol levels in one “good” carrot was equal to 200 of the worst carrots, meaning you would have to consume 200 of the worst carrots to get the same amount of polyphenols of the best carrot.
- Antioxidant levels were as high as 90:1 variation between the best and the worst carrots.
- Iron levels varied in Spinach, where eating one leaf of good spinach vs having to eat fourteen leaves of the worst to give you the same ppm of Iron.
To date the results have been astounding, the data gathered proved there are extreme variabilities in the parameters tested and therefore extreme variabilities in the nutritional content the crops tested. “All carrots aren’t created equal!”
There were also 0-6 and 6-12 inch soil samples submitted from the fields or plots where these crops were grown, along with management systems, fertility programs, etc. for some not all of the samples submitted. The goal is to be able to correlate the crop data directly to the soil, management practices etc. to benefit other growers who desire to grow quality crops. That data is still being processed.
Proving there is variation in crop quality was successful and so data collection in 2019 added lettuce, cherry tomatoes, grapes and kale in addition to more spinach and carrot samples.
Given the current state of agriculture: insecticides, fungicides and simplistic N-P-K fertilizer, it is crystal clear the amount of balanced nutrition in our food is lacking.
Moving forward calibrations are being completed on the first consumer-focused handheld tool to put the power of making purchasing decisions in the consumers hands.
CSI is supporting Dan Kittredge and the BFA as a sponsor as well as being a collaborator to seek out specific crop farms to submit samples from when asked. We feel this is the first step in teaching growers and consumers the benefits of growing and consuming healthy food. Most importantly as a grower, producing high quality nutrient-dense food will warrant a premium on price, growers get paid for what they grow (nutritive value) instead of how much (bushels or lbs.) The consumer will have the tool to make the choice; do they buy the carrot that scores “20” for $2/lb or the carrots that score “80” for $6/lb, knowing from a food benefit standpoint the more expensive carrots have 5-10 times the levels of nutrition, antioxidants, polyphenols, etc.? To those who chose to afford it, it is truly a no-brainer. The plans are to have it in consumers hands by early 2020 according to the BFA website.
The beauty of this entire model is that all data, results, etc. are established up on a Open-Data platform, meaning this is a collaborative effort. This means no one person or organization owns the data. This information, data, etc. cannot be purchased or sold. The BFA has partnered with Cornell University, University of Montana, Penn State University, Ohio State University, Washington State University, the Health Research Institute and an advisory board loaded with PhDs to validate the findings and ensure success.Given proper funding, the BioNutrient Spectrometer will have a huge impact on the way consumers purchase fresh fruits and vegetables. As a producer, this meter could be implemented to determine the effectiveness of different methods of managing soil and plants and ultimately growing quality food.
For more information, to see results, or to make a donation please visit the BioNutrient Food Association’s website. http://bionutrient.org
NOTE: I was fortunate enough to present at this conference in 2016, and have attended this conference as an exhibitor every year since. The next conference is Nov.14-17, 2019 in Southbridge, MA. I strongly encourage anyone to attend. The presenter lineup is always top-notch, facility is great, the attendees are awesome. If you cannot make the conference, the BFA shares the audio only presentations on their website shortly after the conference ends.
-
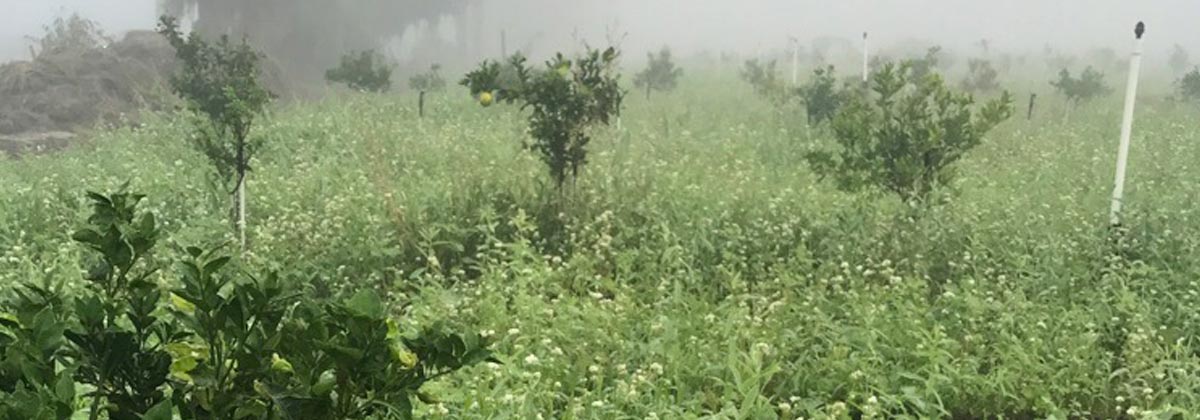
Cover Crops in Citrus Grove
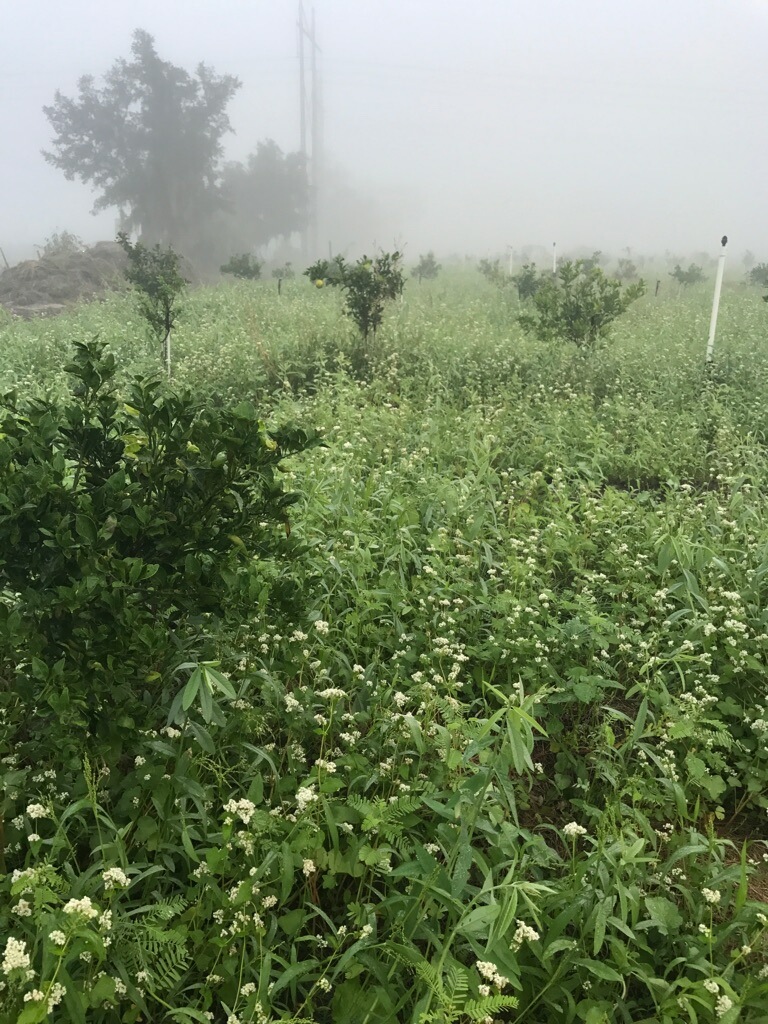
Cover crops and orange trees 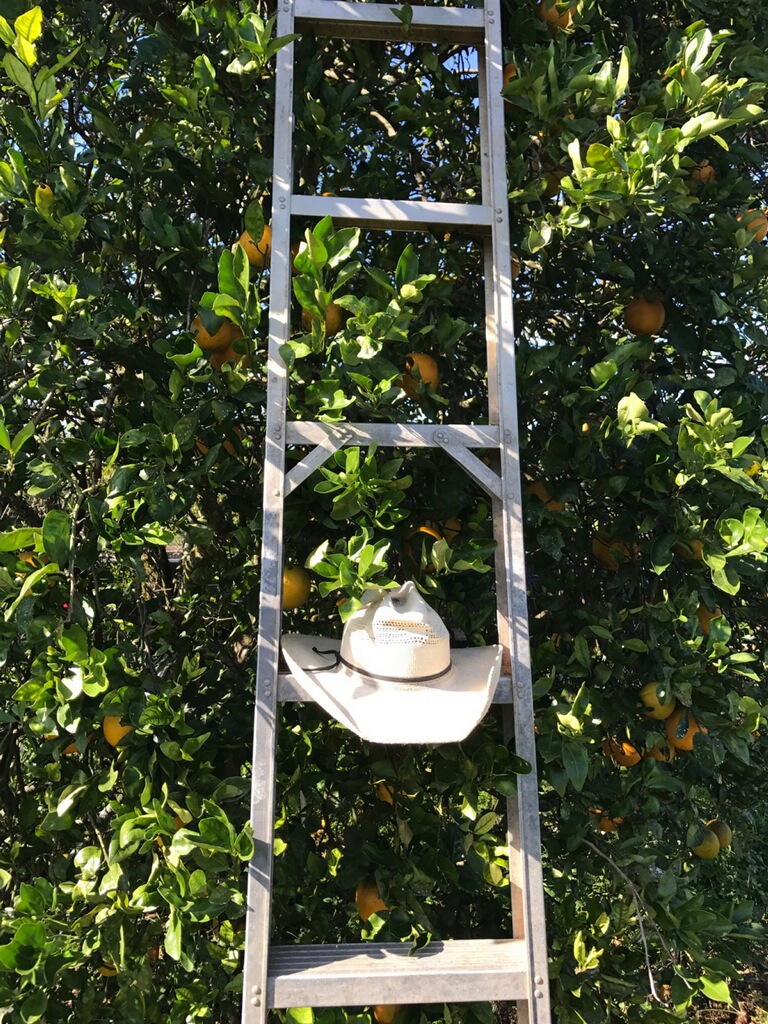
Healthy navel orange tree 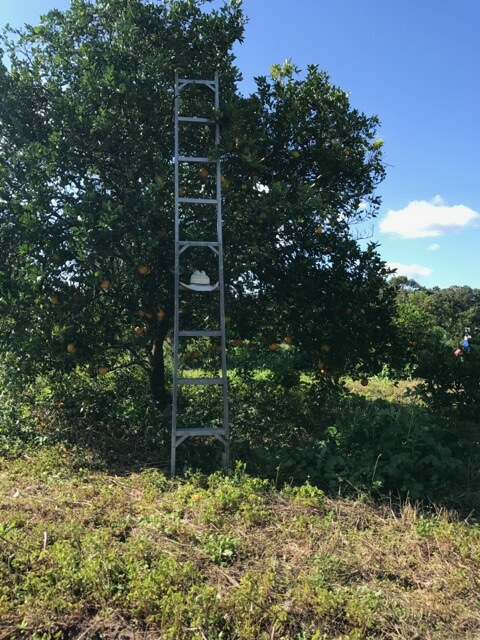
Healthy navel orange tree 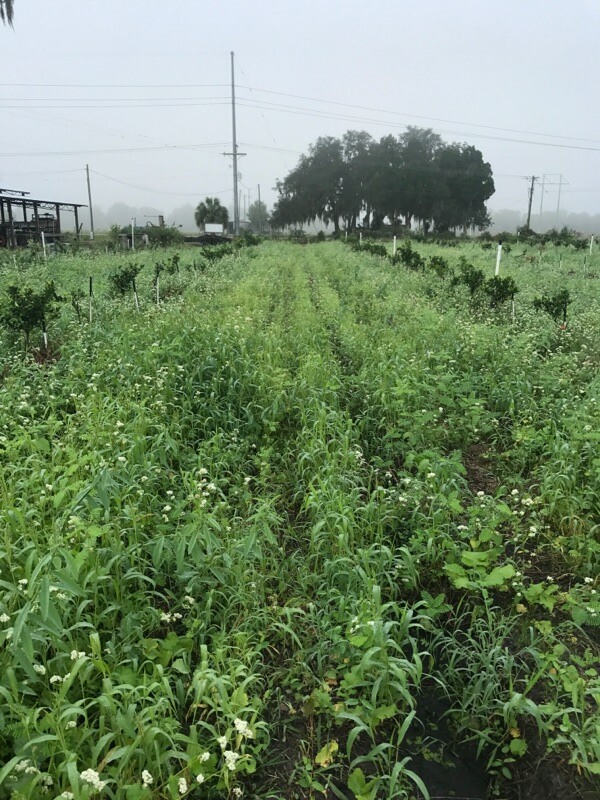
Cover crops 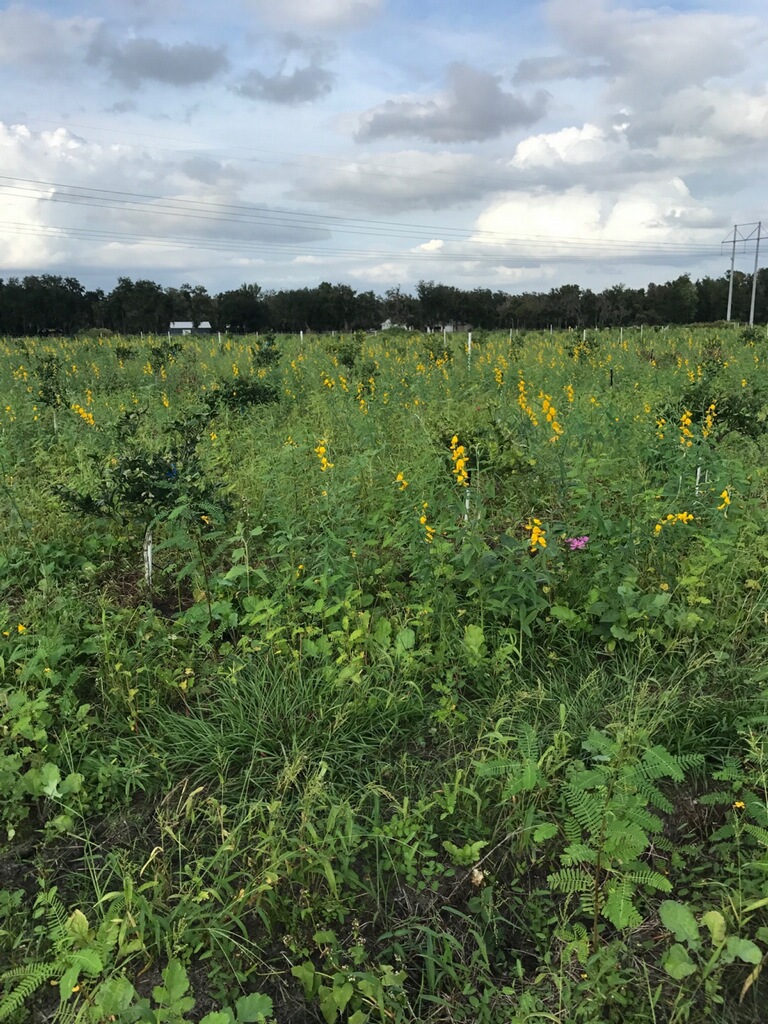
Cover Crops in new grove 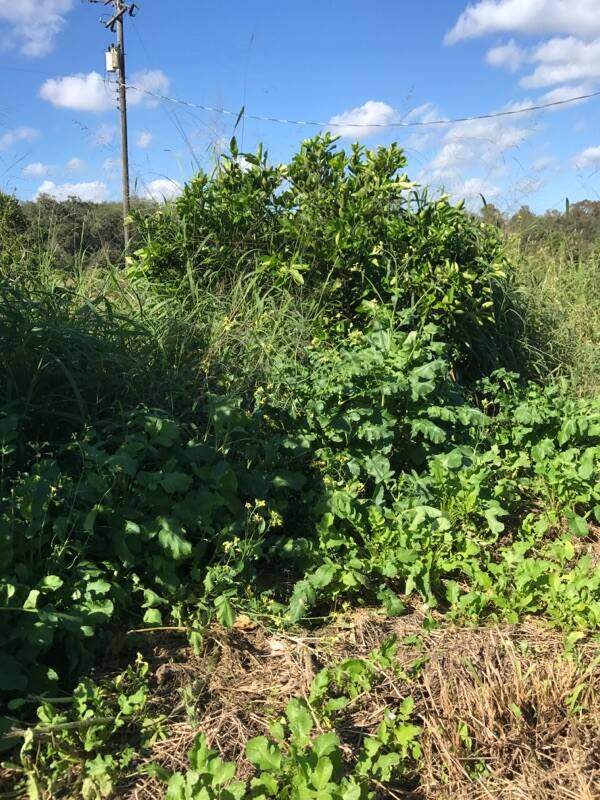
Cover crops and citrus 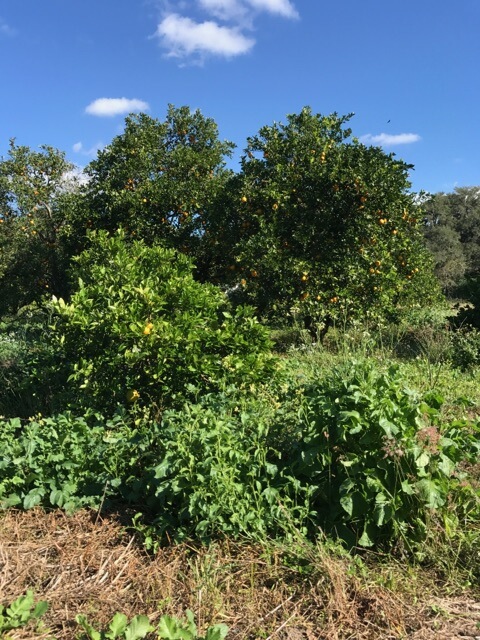
Turner orange tree with cover crops